
Need help applying this to your account?
Contact support and we will keep this article attached to your request.
Reach → Leads → Qualified Leads → Conversion Rate
Referral Factory can report referral and conversion data across the funnel. You can then add business measures such as revenue, customer value, acquisition cost and reward cost when those figures are available in your other systems.
Start with the referral funnel
Reach
Reach measures Referral Link Page views. If someone clicks a referrer’s unique link and views their Referral Link Page, that contributes to Reach.
Reach is not the same as a lead. A page view shows that the referral journey was opened; it does not mean that the person submitted their details.
Referral Link Page viewed = Reach
Leads
Leads are the people captured by the referral programme. With a Referral Link, the lead is created when the referred person submits their details on the Referral Link Page. Other supported capture methods can also add leads.
Track both the number of leads and the change in lead volume over time. A growing Reach number with flat lead volume may suggest that people are viewing the page but not completing the form, although Referral Factory does not explain why an individual chose not to submit.
Qualified or converted Leads
Qualification is separate from lead capture. A new lead can be Pending first and become Qualified after the business-defined success condition happens.
Qualified Leads or Converted Leads are therefore more useful for outcome reporting than leads alone. They help you understand whether the referrals are producing the result your programme is designed to create.
Conversion rate
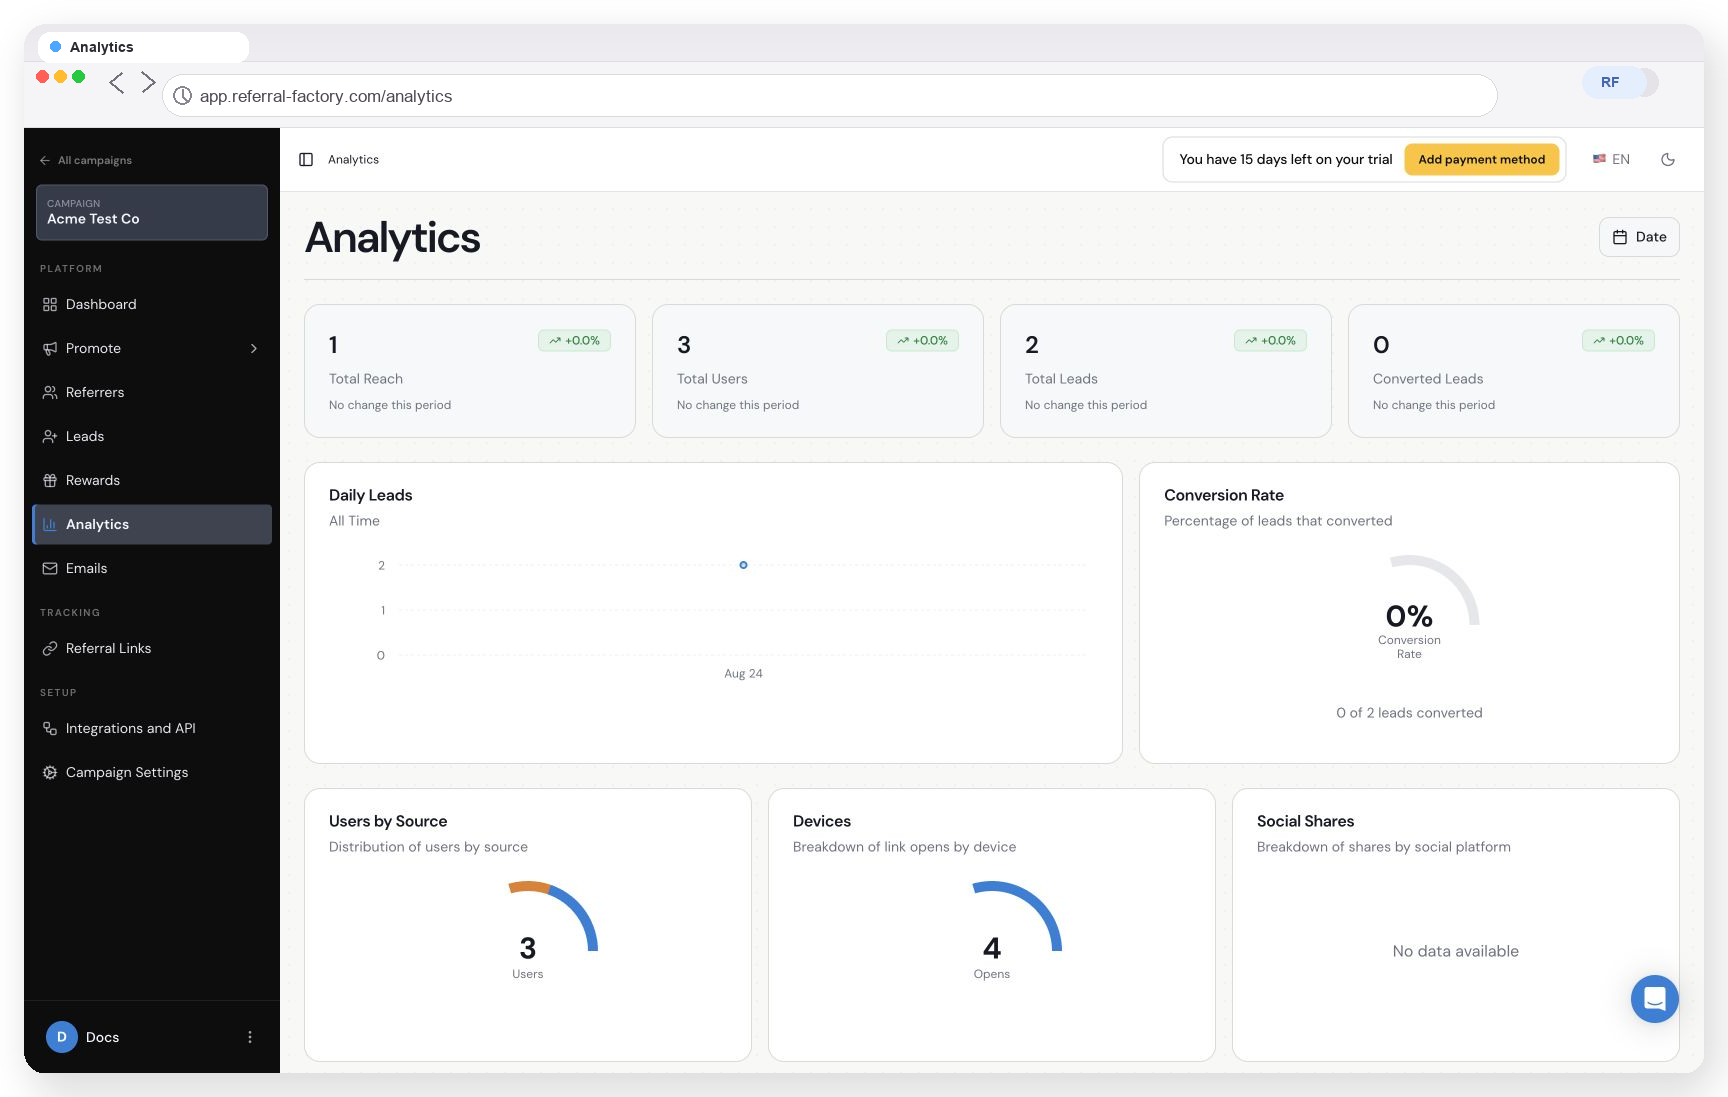
Referral Factory defines Conversion Rate as:
Converted Leads ÷ Total Leads × 100
Review the rate alongside the underlying counts. A small number of conversions can create a high percentage when the lead volume is low, while a larger programme may generate more qualified leads at a lower percentage.
Track the people behind the results
Referrers and users
The number of referrers tells you how many people are actively able to generate referrals. Referral Factory’s Analytics view also reports Total Users, which combines referrers and leads in the campaign reporting.
Keep these concepts separate in your own reporting. A larger user base does not automatically mean more active referrers or more qualified leads.
Top-performing Referrers
Referral Factory’s Your Power Users section helps you compare:
Referrers with most leads, which shows who is generating volume; and
Referrers with most qualified leads, which shows who is generating qualified outcomes.
Looking at both views prevents you from judging performance only by the number of leads. One referrer may generate many low-intent leads, while another generates fewer leads that qualify more often.
Referral source
Users by Source shows how people entered the campaign, such as through a Referral Link, CSV, manual entry or API.
Use source data to understand the mix of referral activity. It is not a replacement for UTM reporting: Referral Factory does not report UTM values in its own Analytics dashboard.
Add context from referral behaviour
Referral Factory can also show:
Devices, which reports the device breakdown for referral-link opens; and
Social Shares, which reports shares by social platform when campaign sharing buttons are used.
These measures help explain how people are interacting with the referral experience. They should be treated as context for the funnel, not as conversion measures by themselves.
Add business KPIs when you have the data
Referral Factory focuses on referral activity and lead outcomes. To understand commercial performance, combine those measures with data from your CRM, payment system, finance platform or data warehouse.
Useful business KPIs may include:
revenue from referred customers;
average order value or customer value;
customer lifetime value;
acquisition cost;
reward cost;
gross margin; and
payback period.
These are not automatically calculated by the Referral Factory Analytics dashboard. They require a reliable connection between referral records and your business or customer records.
What is a good referral conversion rate?
There is no single conversion-rate target that is right for every referral programme. The useful benchmark depends on:
what counts as a conversion;
your industry;
the length of your sales cycle;
the reward you offer;
the type of customer you are targeting; and
how much commitment the referred person must make.
If there is no verified Referral Factory benchmark for your industry, do not use an invented number as a target. Establish your own baseline, then track whether conversion improves over time.
Compare like with like: use the same conversion definition, date range, customer segment and lead source when you review changes. A change in the offer, form, sales process or qualification rule can affect the rate even when the referral traffic stays similar.
How often should I review these metrics?
Use a short-term view to identify changes in activity and a longer-term view to understand the direction of the programme. A practical review might include:
1. Reach and leads to understand current activity.
2. Qualified leads and Conversion Rate to understand outcomes.
3. Power Users and source to see who and what is contributing.
4. Revenue, customer value, acquisition cost and reward cost to understand commercial impact.
The right review cadence depends on your sales cycle. A programme with a long sales cycle may need to monitor Pending leads for longer before judging conversion performance.